So far I have only written how to setup Graylog and send logs to it. But this part was never the goal, the cool dashboards with useful information is the goal. But finding a good real world example of what it can be used for, and how to create those widgets was a bit of a challenge. I never found a good guide for this, most of the guides I have found is like my previous guides. That is, how to setup Graylog and how to fill it with lots of data.
But then I realized that I can use Graylog to collect analytics data from my nginx reverse proxy. So lets build a Analytics dashboard in Graylog!
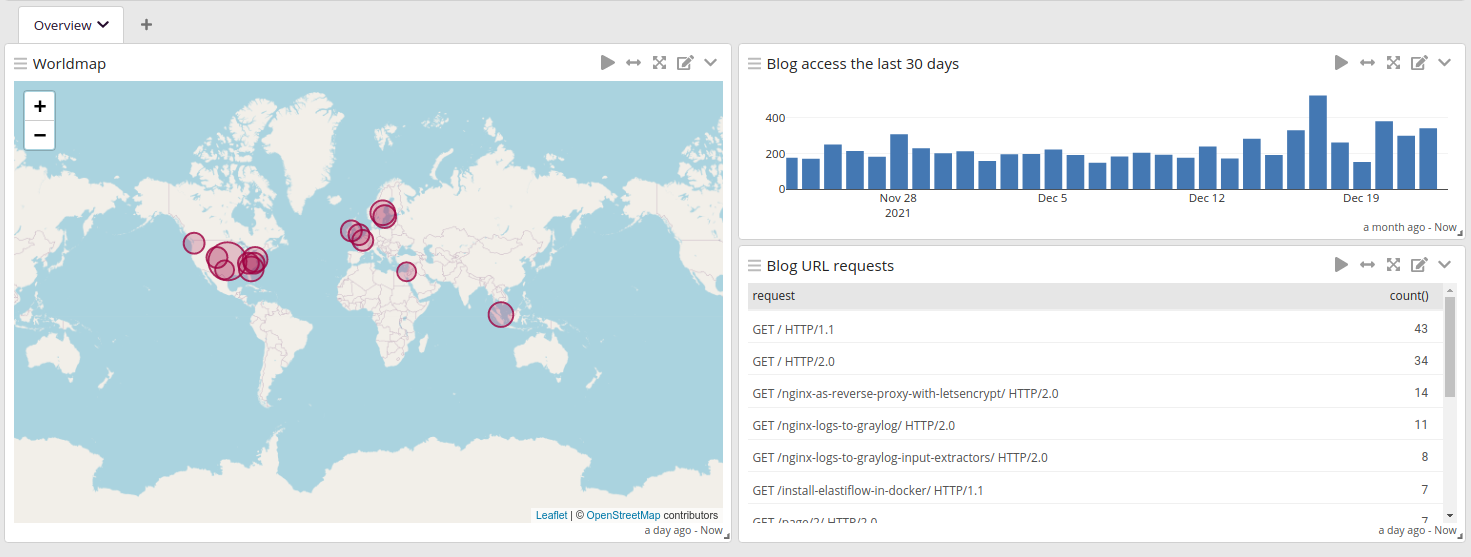
Blog analytics dashboard in Graylog
The downside with an analytics dashboard in Graylog is that page refresh will count as a new view, and you don’t know if the current request is a new reader or an old reader that is returning to your blog. But who cares! you made the Analytics page yourself :)
This guide will assume that you already have Graylog setup with input logs from Nginx that are ready to be filtered. I have not tested, but this should work the same if your logs comes from Apache or any other web server or reverse proxy. The filters may have different names though.
Create a Dashboard
Before we begin to create widgets we will need a Dashboard to save the widgets to else they will be lost, I think, I have not found any other way to save a search widget.
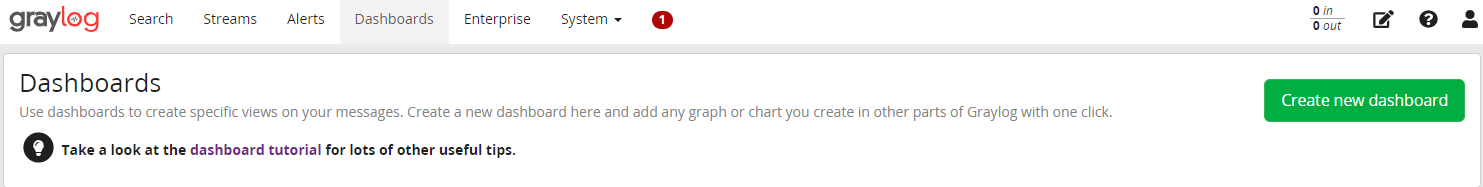
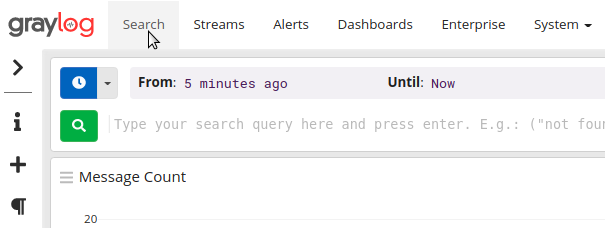
Lets start, Go to Dashboards
And hit the Create new dashboard
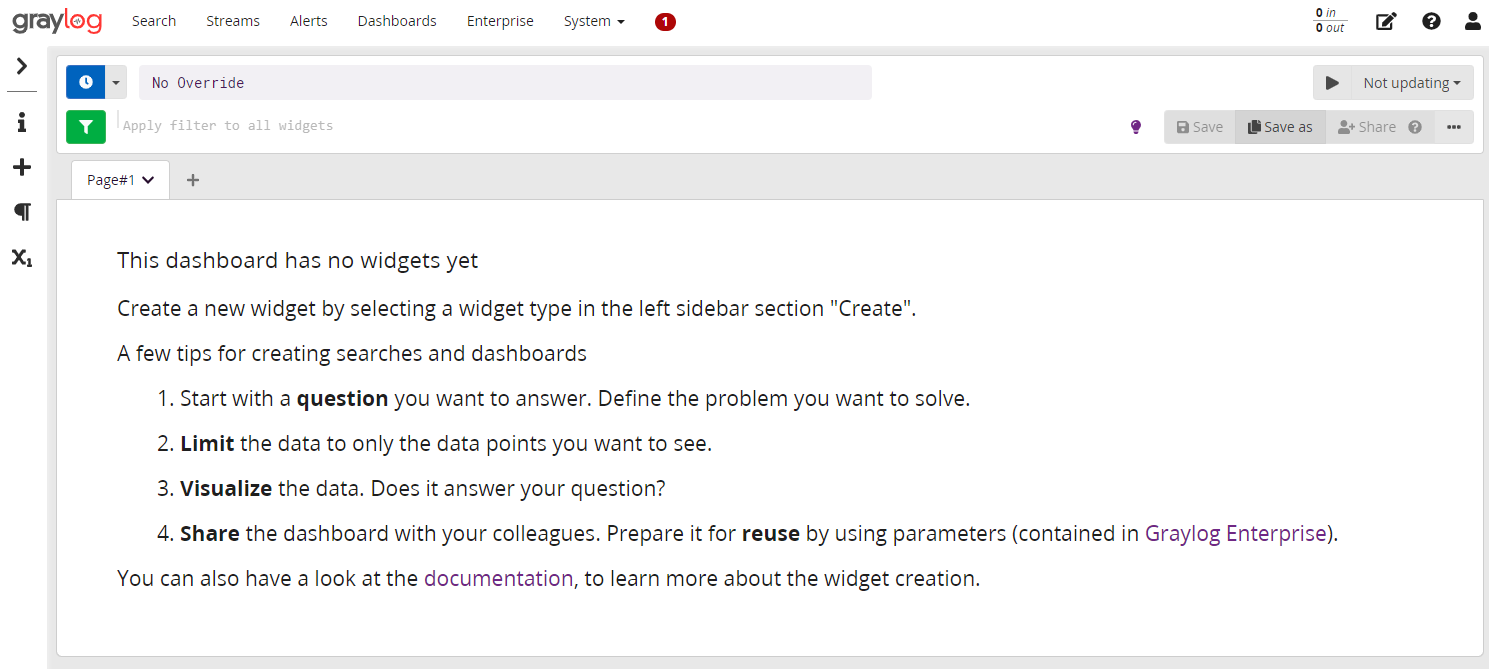
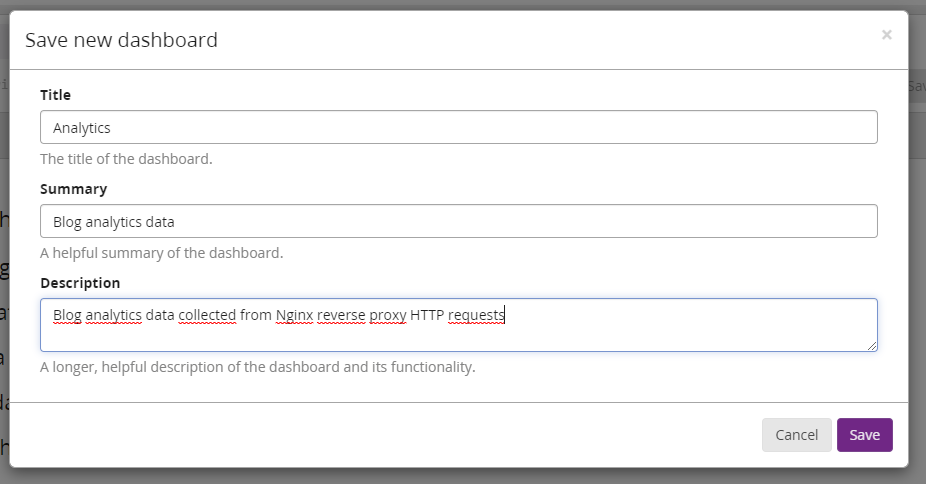
Now we have an empty Dashboard, so lets save the Dashboard and thus giving it a name. Hit Save as
In the Save new dashboard dialog you will give your dashboard a name and write some description for the dashboard, useful if you have a lot of them. Hit Save when you are done.
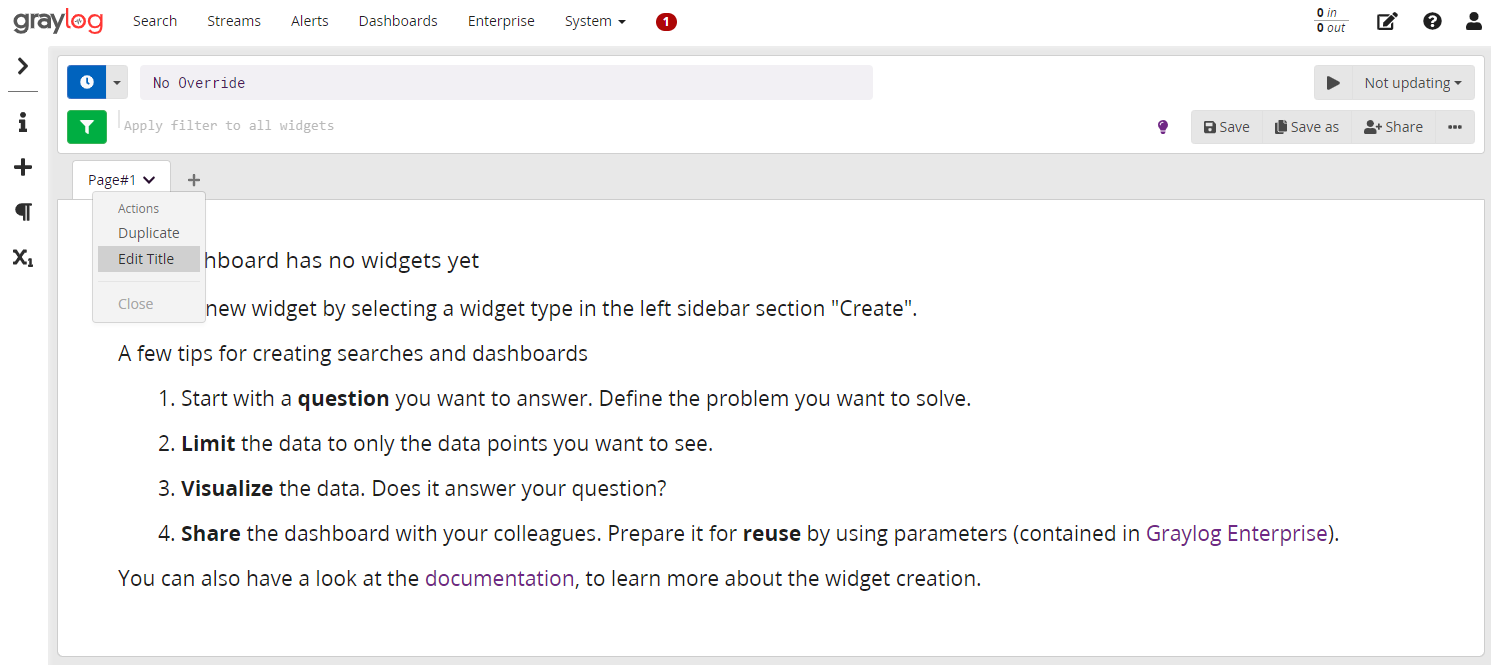
The title of our first tab is by default named “Page#1”, very boring name so lets change it by clicking the down arrow next to the name of the tab and then pres Edit Title.
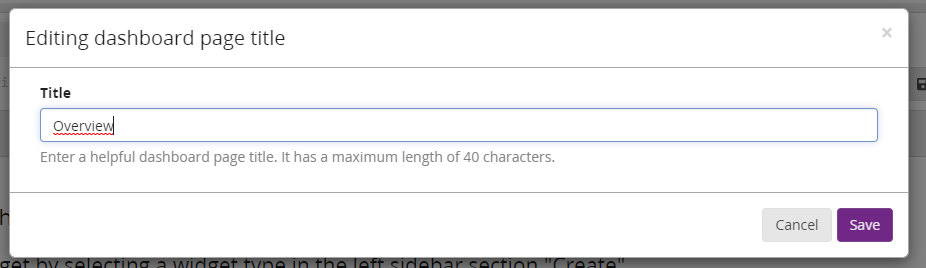
Give your first tab a pretty name like Overview and then hit Save
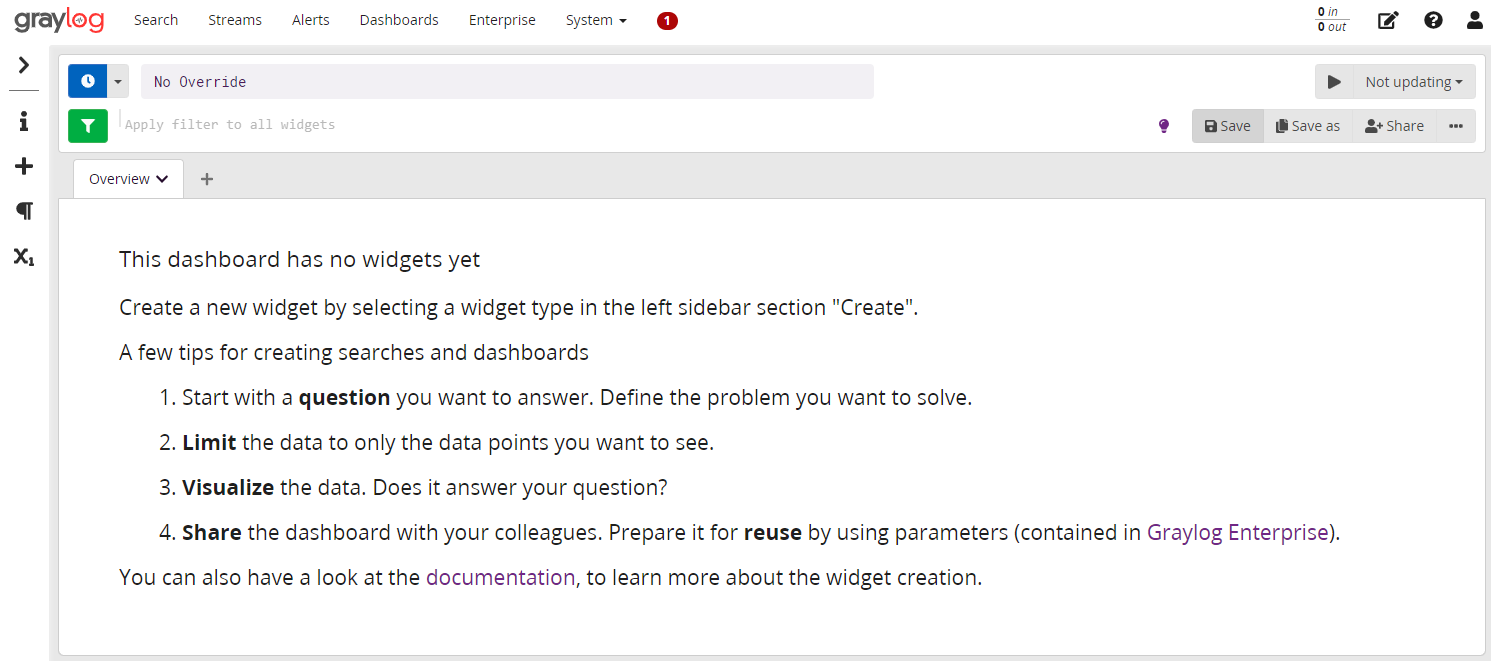
Now we have made some changes to the Dashboard, changed the name of the first tab. But Graylog will not save those changes for you, so you will have to press Save again to save the dashboard changes.
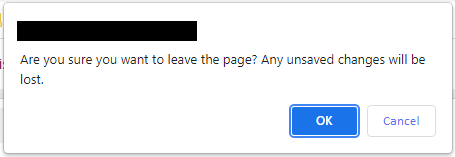
If you forgot to hit Save after changing a dashboard, you will receive a warning from Graylog when you try to go to another view, like Search.
If you hit OK you will loose your changes, if you hit Cancel you will stay on the page and you can hit Save before you move on to another Graylog view.
Now we have an empty Dashboard and finally we can start creating some cool widgets for it.
Create Widgets
Most of my widgets is using a filtered search for URL requests to my blog. The filter will remove any requests for assets like images, CSS or JS files it will also remove request to some resource URL that is part of the blog platforms internal sub-requests. Because we are only interested in the actual request to the blog post it self.
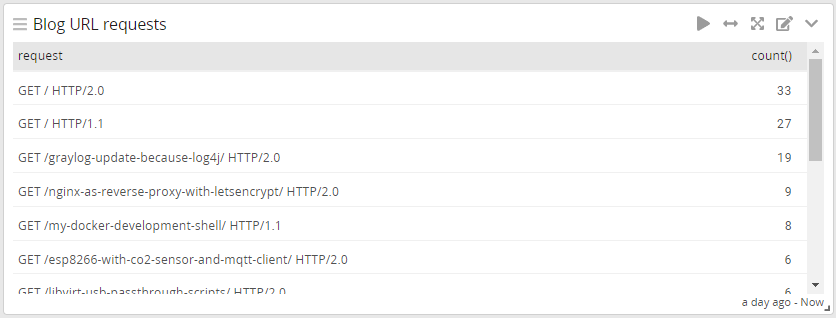
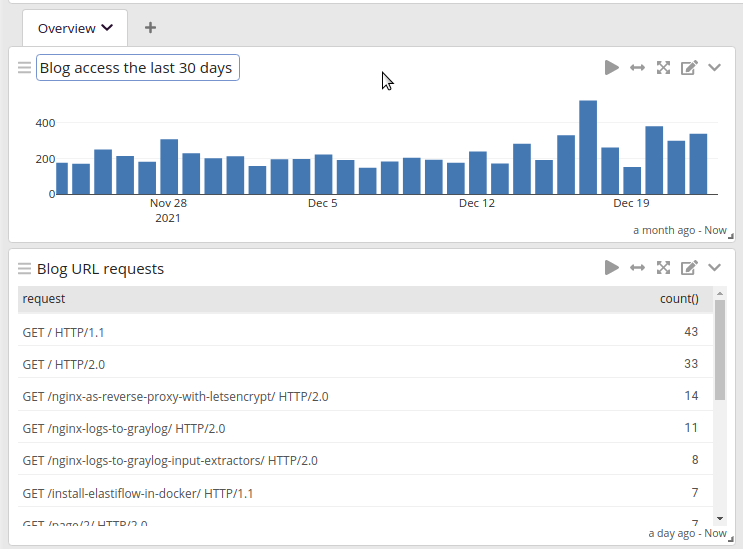
Blog URL requests
URL requests counter, because of the filter we will get a nice counter for each of our blog posts.
Lets create this widget
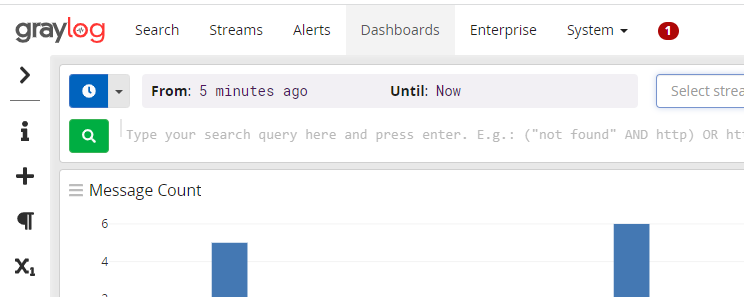
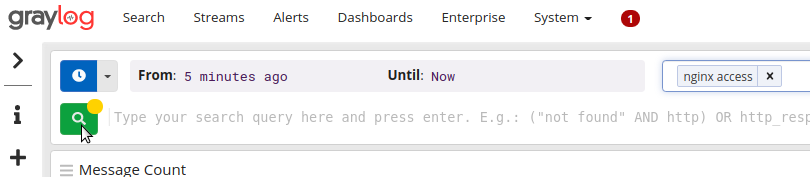
We start at the Search view
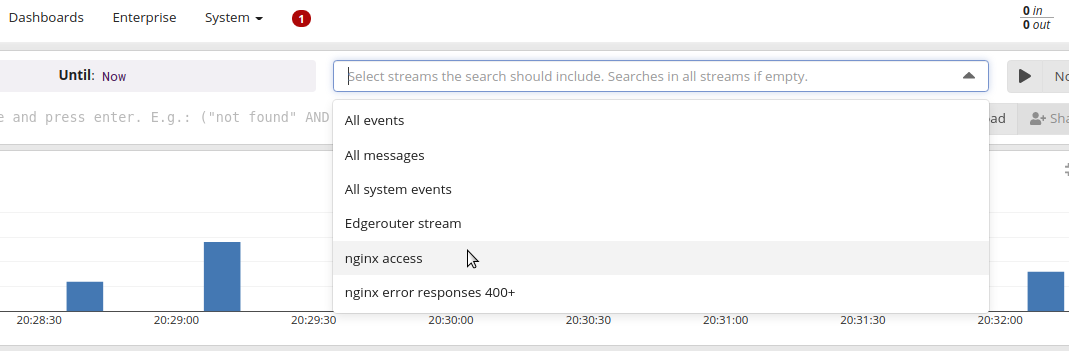
Select a search stream if you have one
Hit the search button to filter all the messages to the selected stream only
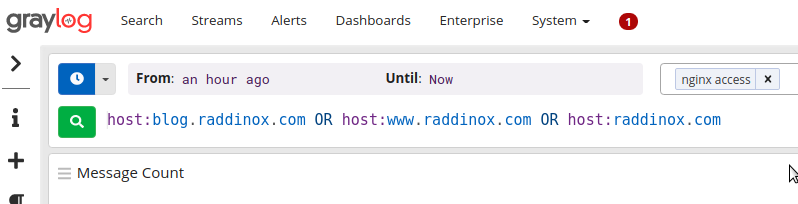
Because I want analytics data for my blog I only want to see access to that host. Remember that OR must be written with big letters.
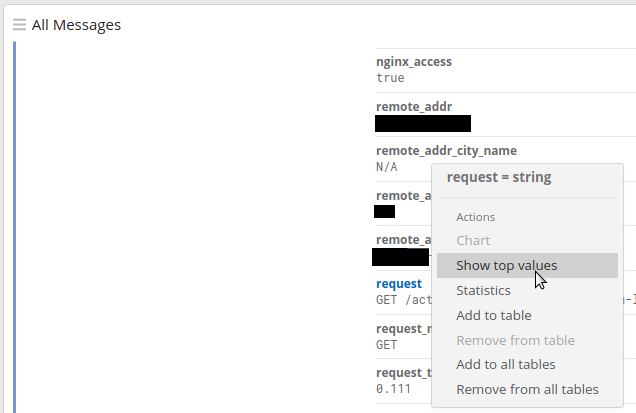
Now expand a message by clicking on it, find the field containing the request string. In my case the field is called request. Click the small down arrow to show the menu, click Show top values
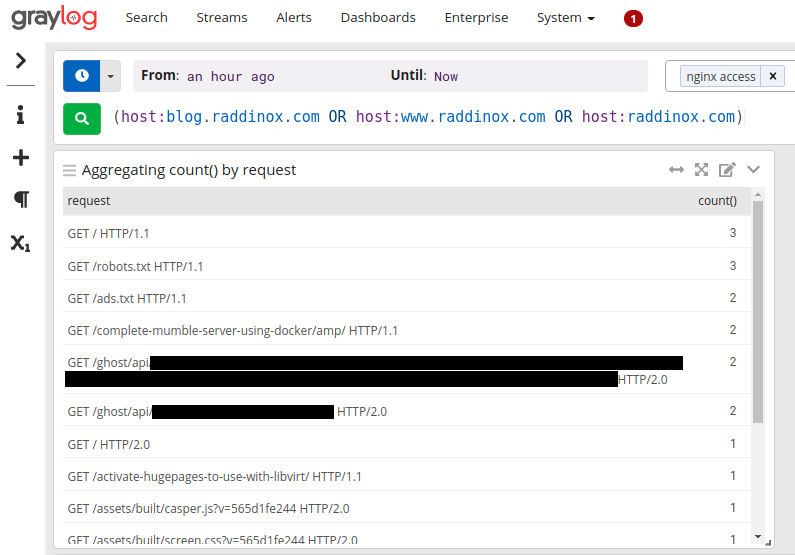
Now we have a widget at the top for our search.
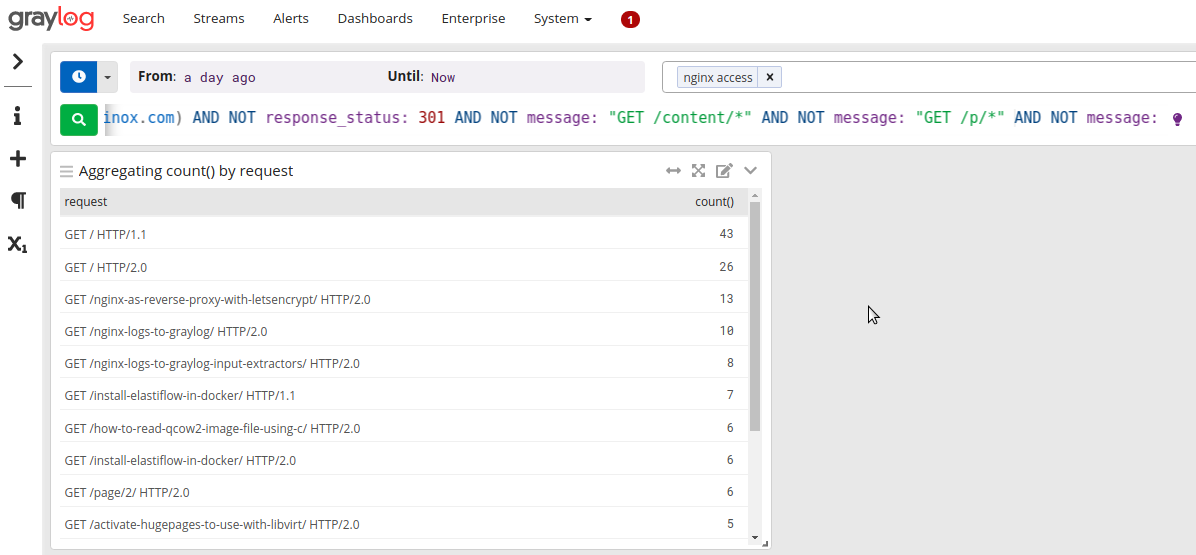
But the widget does contain a lot of sub-requests for assets like Image, CSS and JS files. There will also be random search bots requests and other requests like /robots.txt and /ads.txt.
So lets start filtering our widget, first I will remove all requests with a 301 HTTP response because those are redirects (e.g. HTTP -> HTTPS), I don’t want them to count twice. And then I added a long string to filter away all those other assets. Then hit the small search button, if you still find some unwanted results just add it to the search field and hit the search button again.
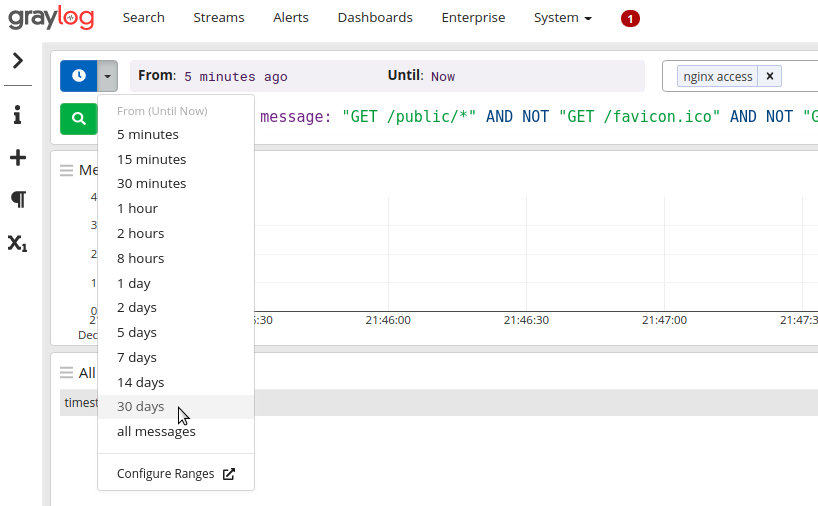
You can use the little clock icon to increase the search range back in time to get more results to filter away.
When you are satisfied, copy your search string so we can use it for the next widget.
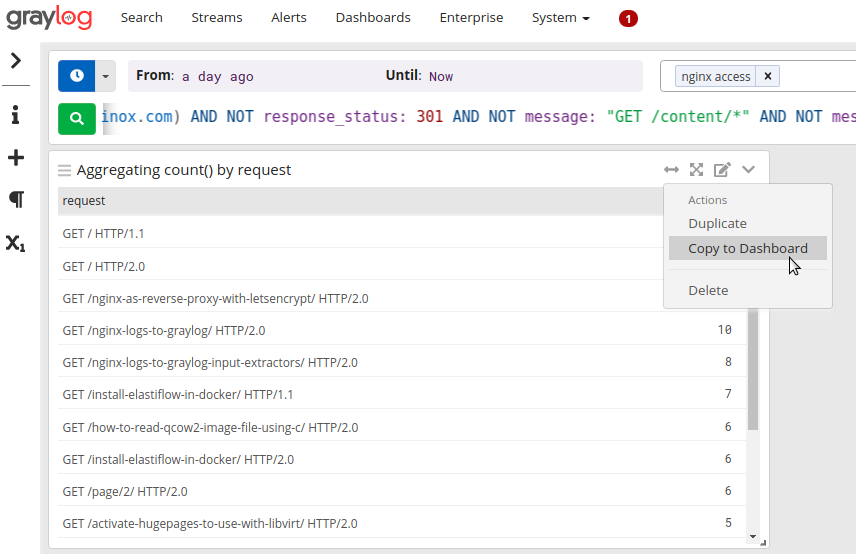
Then you click the small down arrow and then click Copy to Dashboard
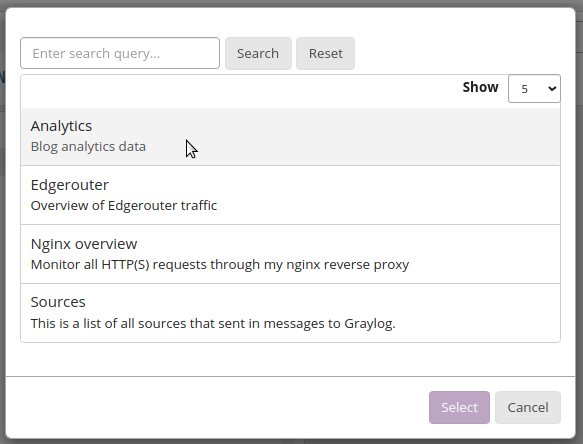
Select the dashboard and hit Select
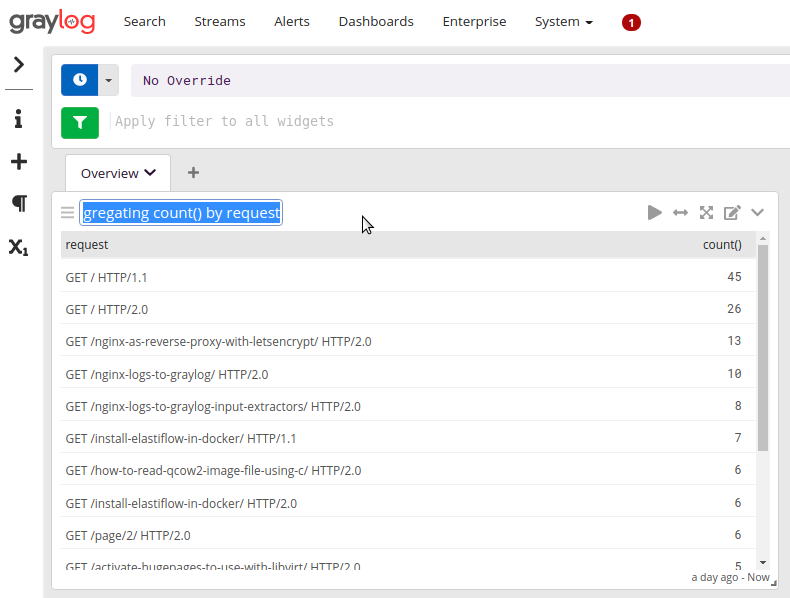
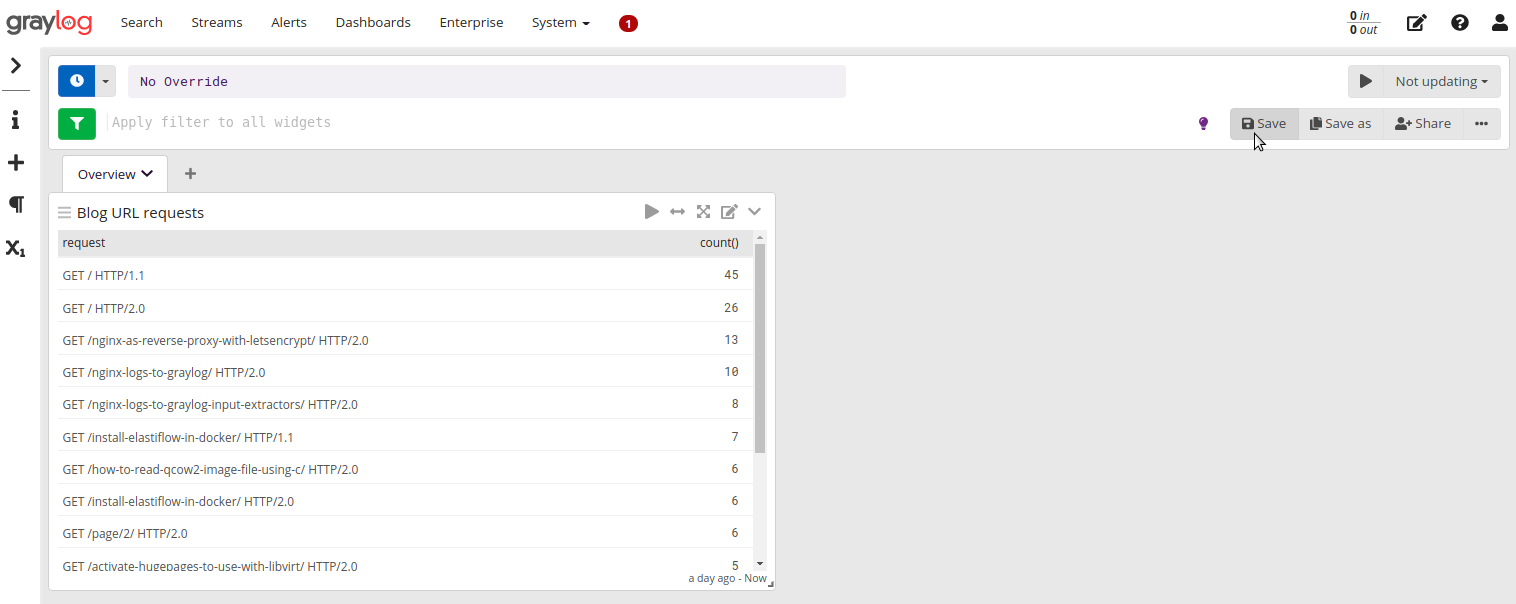
Finally we have a widget in our Dashboard. We can rename it by double-clicking on the title.
When we are done renaming, hit the Save button to save the Dashboard changes.
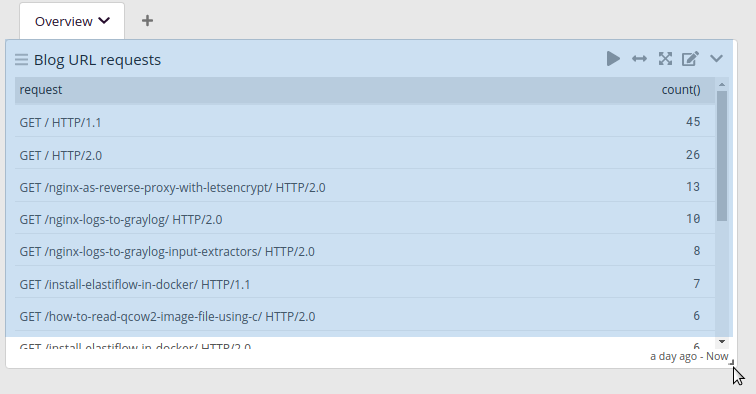
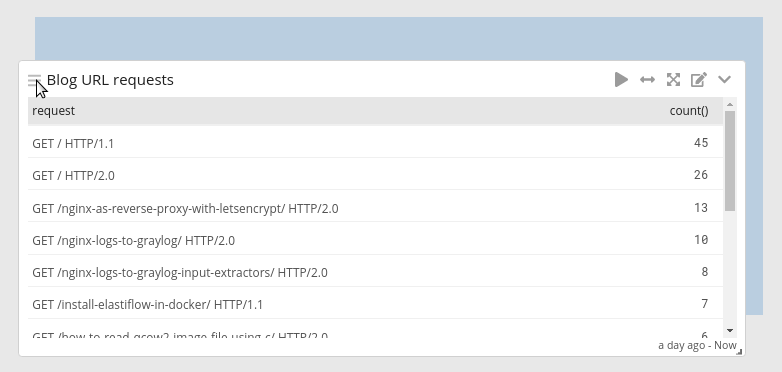
You can resize the widget by dragging the bottom right corner
And move the widget by dragging the top left corner
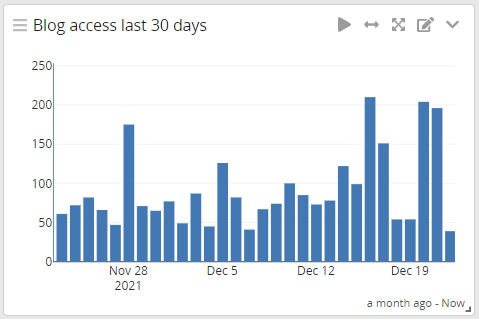
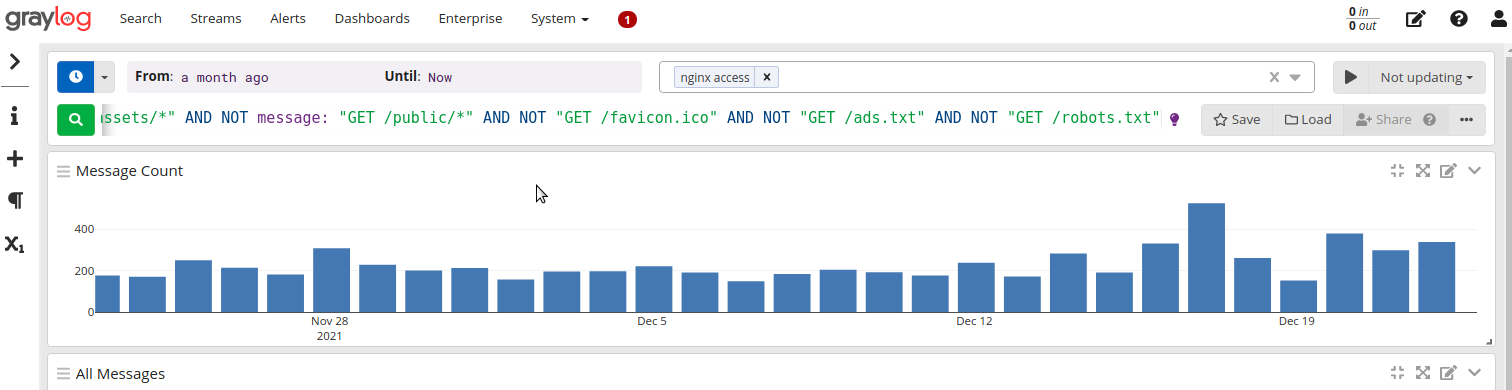
Blog access the last 30 days
Pretty bar chart widget for the number of views over the last 30 days.
Go back to Search view and select your stream paste your search string you saved from the previous widget we created. This time I made sure to change the time using the small clock to a month ago
Now we get the pretty bar chart widget for free
Just like we did with the previous widget, click the small arrow in the top right corner and select Copy to Dashboard. Select the dashboard in the popup dialog just as before
Now change the name of the widget and hit Save to save our changes to the Dashboard
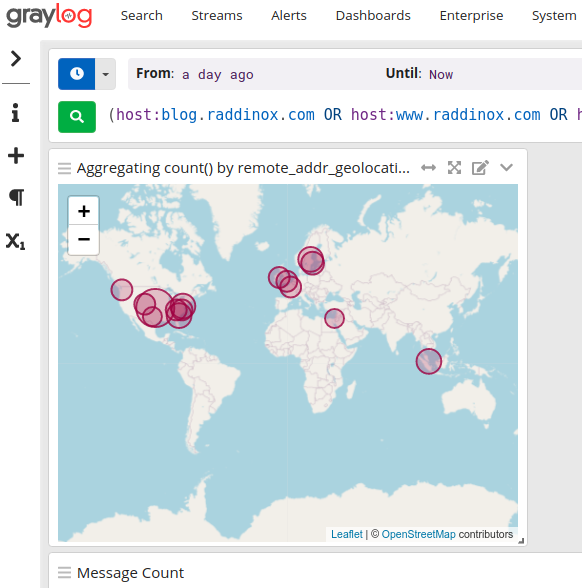
World map
Just like the last widget, go back to Search view. Select stream and paste your search string. Hit search to filter the messages.
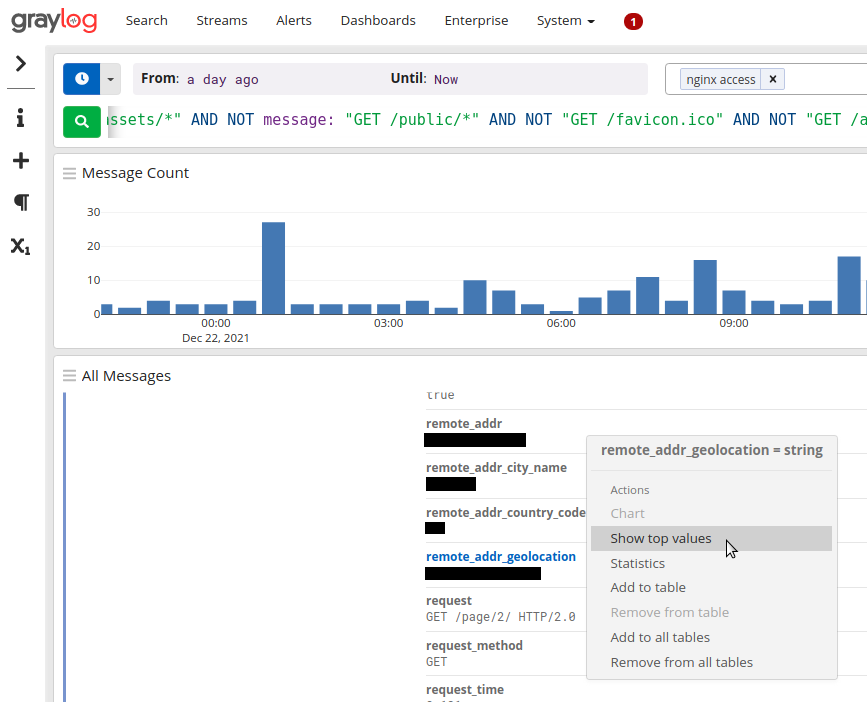
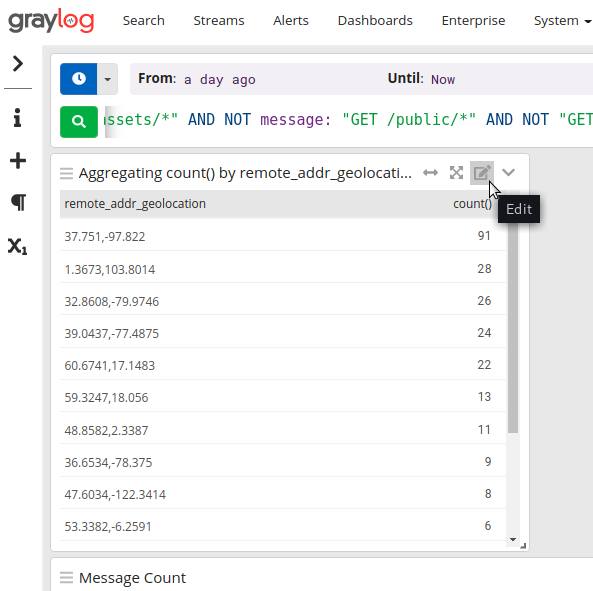
Expand a message and find the field with geolocation coordinates. Click the small down arrow on, in my case, remote_addr_geolocation field name. Select Show top values
This will give us a new widget at the top, click the Edit button to modify the widget
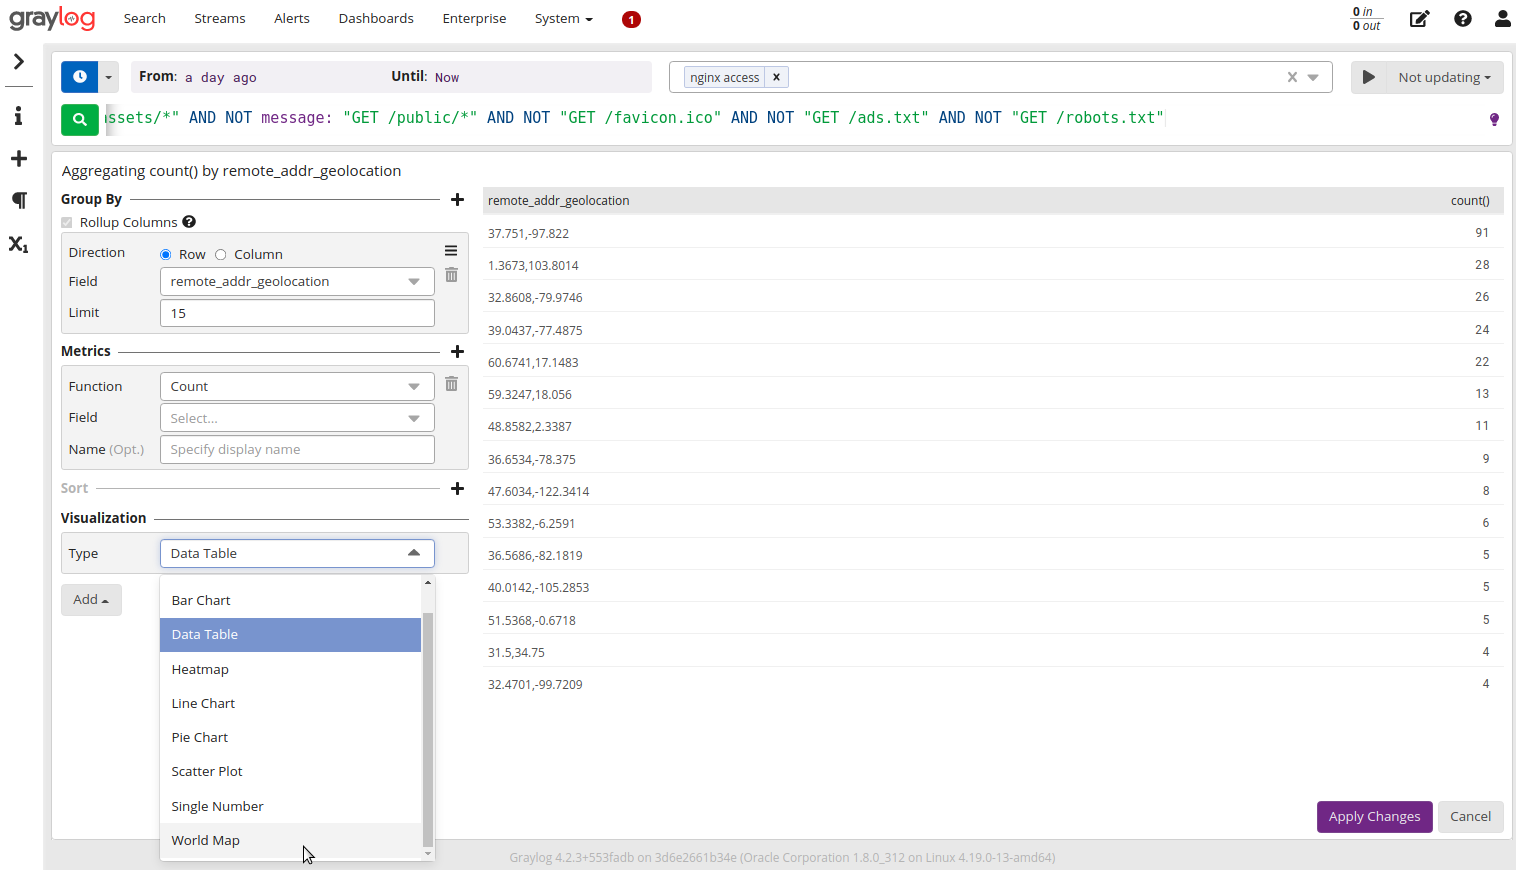
In the widget editor, change the Type to World Map
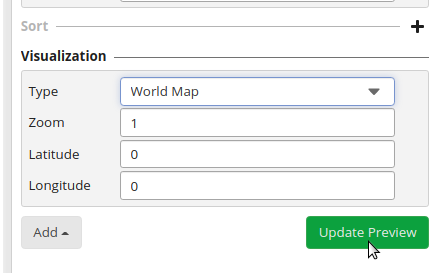
Hit Update Preview
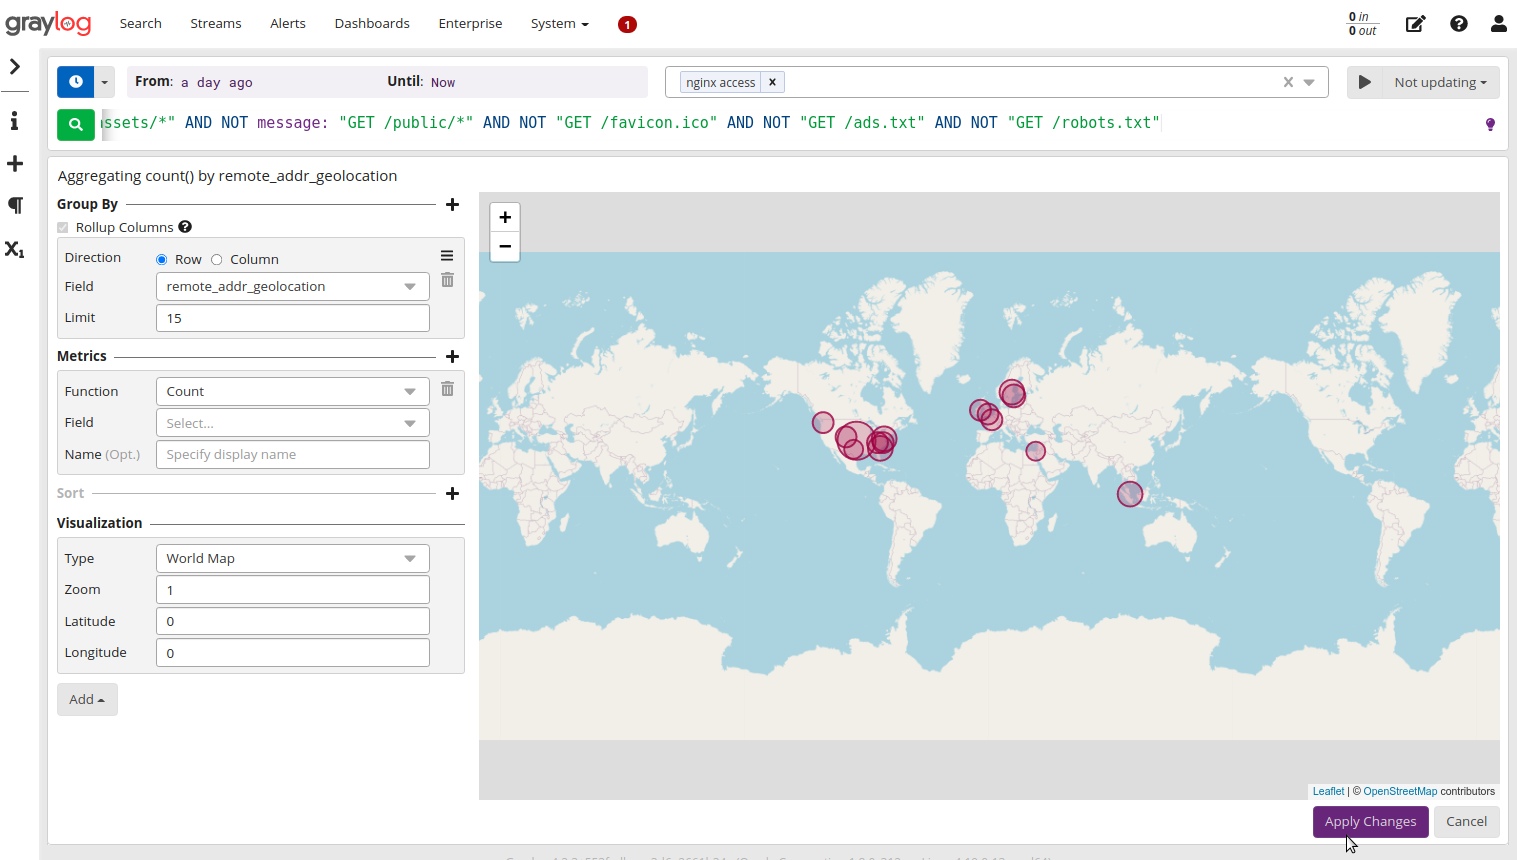
And like magic we have a pretty World map with some blobs where requests are coming from. Hit Apply Changes to save the widget
The widget are still in the Search view. So just like the other widgets, click the small down arrow in the top right and chose Copy to Dashboard
And again, select the Dashboard
And finally we have the Worldmap in our Dashboard, double-click the title to change it and hit the Save button to save the Dashboard.